

Climate indicators – what are they and what do they mean?

Niño 3.4 Ocean index
A sea surface temperature anomaly in the tropical Pacific Ocean believed to be the best suited SST index affecting the Australian climate more generally. A strongly positive value is associated with El Niño (historically dry) events and a strongly negative value is associated with La Niña (historically wet) events (image below courtesy NOAA).
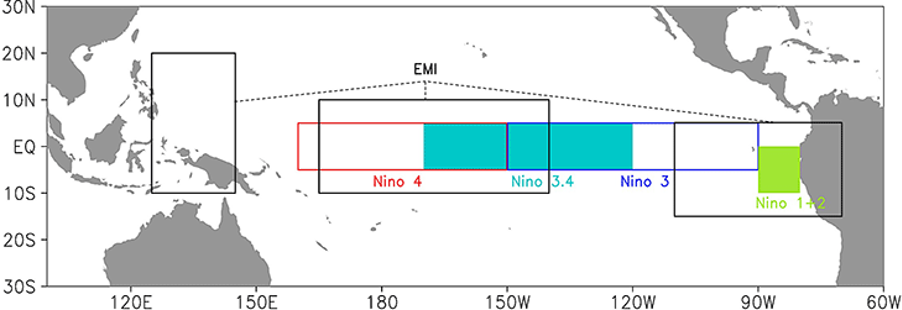
Modoki Index (or EMI index)
A sea surface temperature index in the tropical Pacific Ocean calculated using the Niño indices as well as two other regions. This helps understand convection and atmospheric circulation across the Pacific in more detail - impacting central-eastern Australian agricultural areas in particular. This indicator is favourable for rainfall when values are negative. Memorable EMI years are 1997 (La Niña Modoki) and 2002 (El Niño Modoki) where this index was at odds with Niño 3.4.
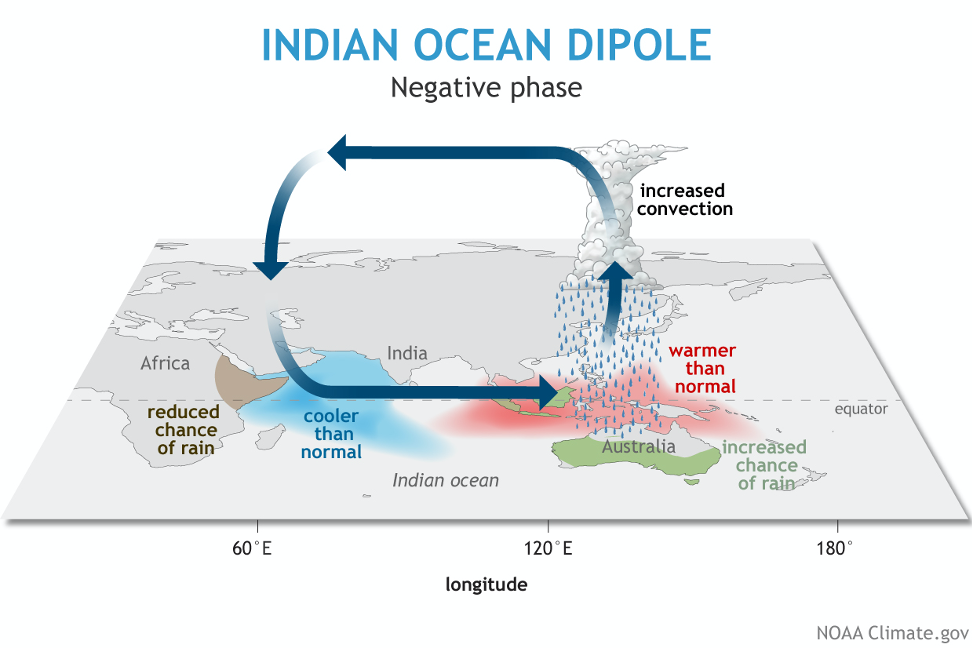
Indian Ocean Dipole (IOD)
A sea surface temperature index in the Indian Ocean. With the exception of central and southern NSW, this is a secondary moisture source during winter and spring seasons for much of NSW and Qld. The IOD index represents the distribution of warm or cool ocean currents in the Indian Ocean. Memorable IOD years are 2016 (negative - wet) and 2019 (positive -dry). A negative Indian Ocean is favourable for moisture supply, as depicted by the figure below (image courtesy NOAA).
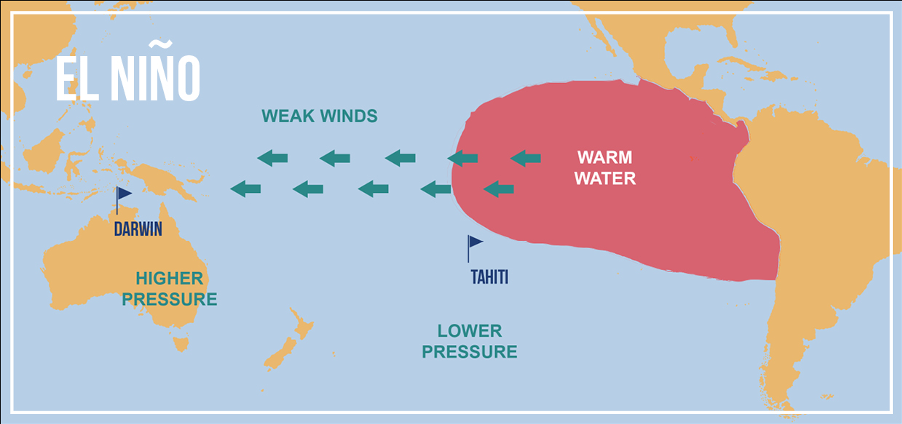
Southern Oscillation Index (SOI)
This is an air pressure measurement calculated from data taken from Tahiti and Darwin and derived into either positive or negative values - showing departure from ‘normal’ conditions. The 30 or 90 day SOI represents atmospheric circulation in the tropical Pacific Ocean. When the SOI is positive, mean sea level air pressure over Darwin is lower, and conditions (historically) are more favourable for rain at certain times of the year. As a general rule the SOI has the most influence in winter, spring and early summer across eastern Australia. The chart below shows the relationship between the wind strength and air pressure at Darwin and Tahiti.

Southern Annular Mode (SAM)
The SAM is a measurement of air pressure at two locations around Antarctica (similar to the SOI) which shows the winds either expanding or contracting from the south pole. The phases of the SAM have been found to influence eastern Australian moisture supply during the spring and summer seasons. When the SAM is in positive phase, easterly circulation patterns can feed tropical moisture into frontal systems and troughs moving through eastern Australia. The best visual explanation of the SAM can be found by clicking on the 2-minute YouTube animation below.

The Madden-Julian Oscillation (MJO)
The MJO is a tropical disturbance that moves eastward around the global tropics every 30-60 days and has proven to influence the Australian climate, mainly during the warmer months of the year. The strength of the MJO may increase or decrease as it progresses eastwards, and its presence can affect convection and influence on both precipitation and temperature. The phases of the MJO represent the geographical area, as shown in the figure below. An animation explaining the characteristics of the MJO can be found on the link here.